Project
Monitoring (Prometheus + Grafana)
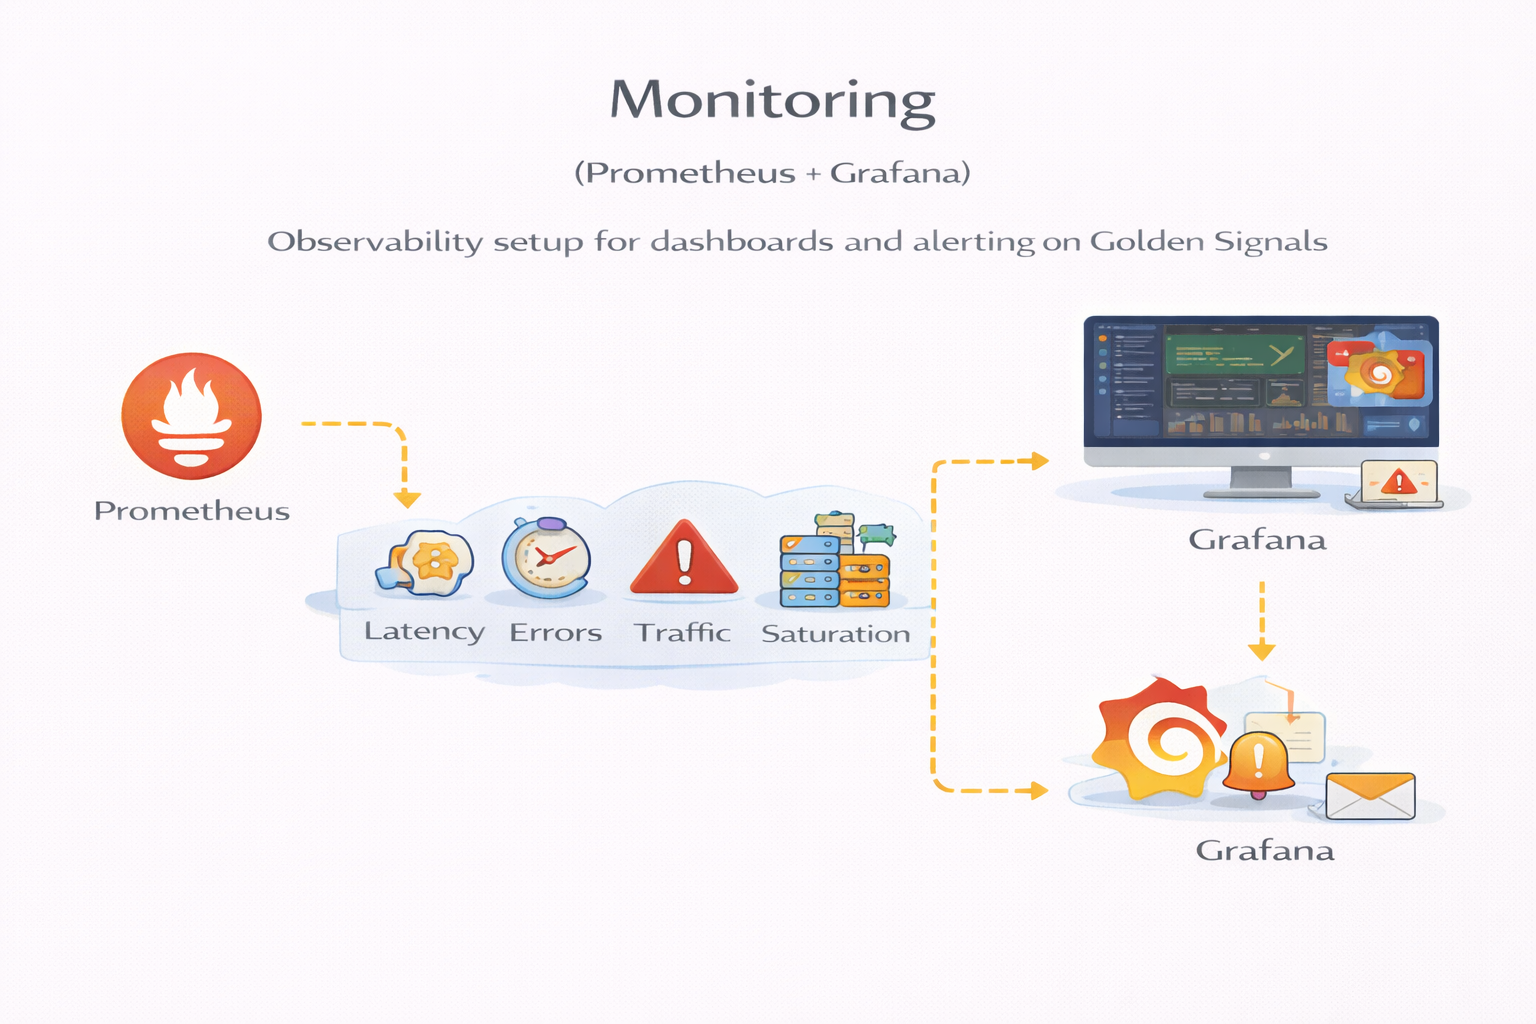
Observability setup for dashboards and alerting based on Golden Signals.
Project Summary
- ProblemWithout monitoring, outages are detected late and root cause takes longer.
- SolutionScrape metrics with Prometheus, visualize with Grafana, alert on latency/errors/saturation.
- ToolsPrometheus · Grafana · Alert rules · Node/Kube metrics
- OutcomeFaster incident detection, clear dashboards, and better understanding of system health trends.
Diagram